This part covers audit procedures generally performed on sales customers.
Sales summary table by customers and months
  # A tibble: 10 x 7
  # Groups:   name [8]
     name                           month  freq credit    pct cum_amt cum_pct
     <chr>                          <ord> <int>  <dbl>  <dbl>   <dbl>   <dbl>
   1 Baker's Professional Lighting~ Feb       7  2391  1        2391   1
   2 Baker's Professional Lighting~ May       7  2038  0.160    2038   0.160
   3 Baker's Professional Lighting~ Dec       6 10680. 0.840   12718.  1
   4 Baker's Professional Lighting~ Feb      10  1885  0.570    1885   0.570
   5 Baker's Professional Lighting~ Dec       7  1422  0.430    3307   1
   6 Baker's Professional Lighting~ Mar       8  1872  1        1872   1
   7 Baker's Professional Lighting~ Jan      10  2381  1        2381   1
   8 Cole Home Builders:Phase 1 - ~ Feb      17  2187. 1        2187.  1
   9 Cole Home Builders:Phase 1 - ~ May      17  2187. 1        2187.  1
  10 Cole Home Builders:Phase 1 - ~ Apr      17  2187. 0.0845   2187.  0.0845
Month over month sales by customers
  # A tibble: 28 x 4
  # Groups:   name [14]
     yearmonth name                                    monthlysales   mom
     <chr>     <chr>                                          <dbl> <dbl>
   1 2018-12   Baker's Professional Lighting:Store #10       10680. 424.
   2 2018-12   Lavery Lighting & Design:Store #JL-08          2708. 351.
   3 2018-12   Thompson Lighting Stores:Store #15            11800  290.
   4 2018-06   Cole Home Builders:Phase 1 - Lot 5             5834. 256.
   5 2018-02   Cole Home Builders:Phase 2 - Lot 5             4364   99.5
   6 2018-04   Godwin Lighting Depot:Store #202               1688. -78.3
   7 2018-07   Cole Home Builders:Phase 1 - Lot 5             9803.  68
   8 2018-06   Kern Lighting Warehouse:Store #45             14175   66.8
   9 2018-05   Cole Home Builders:Phase 2 - Lot 5             1637. -62.5
  10 2018-11   Kern Lighting Warehouse:Store #01              9839  -60.8
  # ... with 18 more rows
Relative Size Factor test (RSF)
Could also include mean computed without the first larget number to help you decide relevant RSF score. Here, 0.6 is the chosen cut-off.
  # A tibble: 43 x 5
  # Groups:   name [43]
     date       num   name               memo                             rsf
     <date>     <chr> <chr>              <chr>                          <dbl>
   1 2018-02-14 71110 Baker's Professio~ River Rock (8/60 watt)  Faux ~ 0.706
   2 2018-12-07 71138 Baker's Professio~ Fluorescent Lamp, Medium Bipi~ 0.945
   3 2018-03-11 71048 Baker's Professio~ Polished Brass Pendant, 1-100~ 0.778
   4 2018-01-06 71047 Baker's Professio~ Pearl Nickle, 5 Light, Medium~ 0.95
   5 2018-02-12 71088 Cole Home Builder~ Pearl Nickle, 5 Light, Medium~ 0.931
   6 2018-05-24 71086 Cole Home Builder~ Pearl Nickle, 5 Light, Medium~ 0.931
   7 2018-06-07 71085 Cole Home Builder~ Die Cast Lanterns, Black, 1-1~ 1
   8 2018-08-22 71109 Dan A. North Buil~ Tapestry, (2-60 watt Med), Et~ 0.9
   9 2018-04-28 71067 Dan A. North Buil~ Beveled Mirror, Etched Ribbed~ 0.807
  10 2018-05-30 71069 Godwin Lighting D~ Verona Collection, Pendant, C~ 0.923
  # ... with 33 more rows
Top 10 customers
| name | amt | freq | pct |
|---|---|---|---|
| Other | $166,063 | 440 | 40% |
| Kern Lighting Warehouse:Store #13 | $37,725 | 32 | 9% |
| Kern Lighting Warehouse:Store #01 | $34,929 | 20 | 8% |
| Kern Lighting Warehouse:Store #34 | $34,625 | 21 | 8% |
| Kern Lighting Warehouse:Store #45 | $30,675 | 16 | 7% |
| Cole Home Builders:Phase 1 - Lot 5 | $25,877 | 196 | 6% |
| Stern Commercial Contractor’s:Walker Properties | $21,330 | 5 | 5% |
| Stern Commercial Contractor’s:Tittle Properties | $17,433 | 6 | 4% |
| Thompson Lighting Stores:Store #15 | $14,825 | 27 | 4% |
| Stern Commercial Contractor’s:Wilson Suites | $14,355 | 3 | 3% |
| Cole Home Builders:Phase 2 - Lot 5 | $13,973 | 81 | 3% |
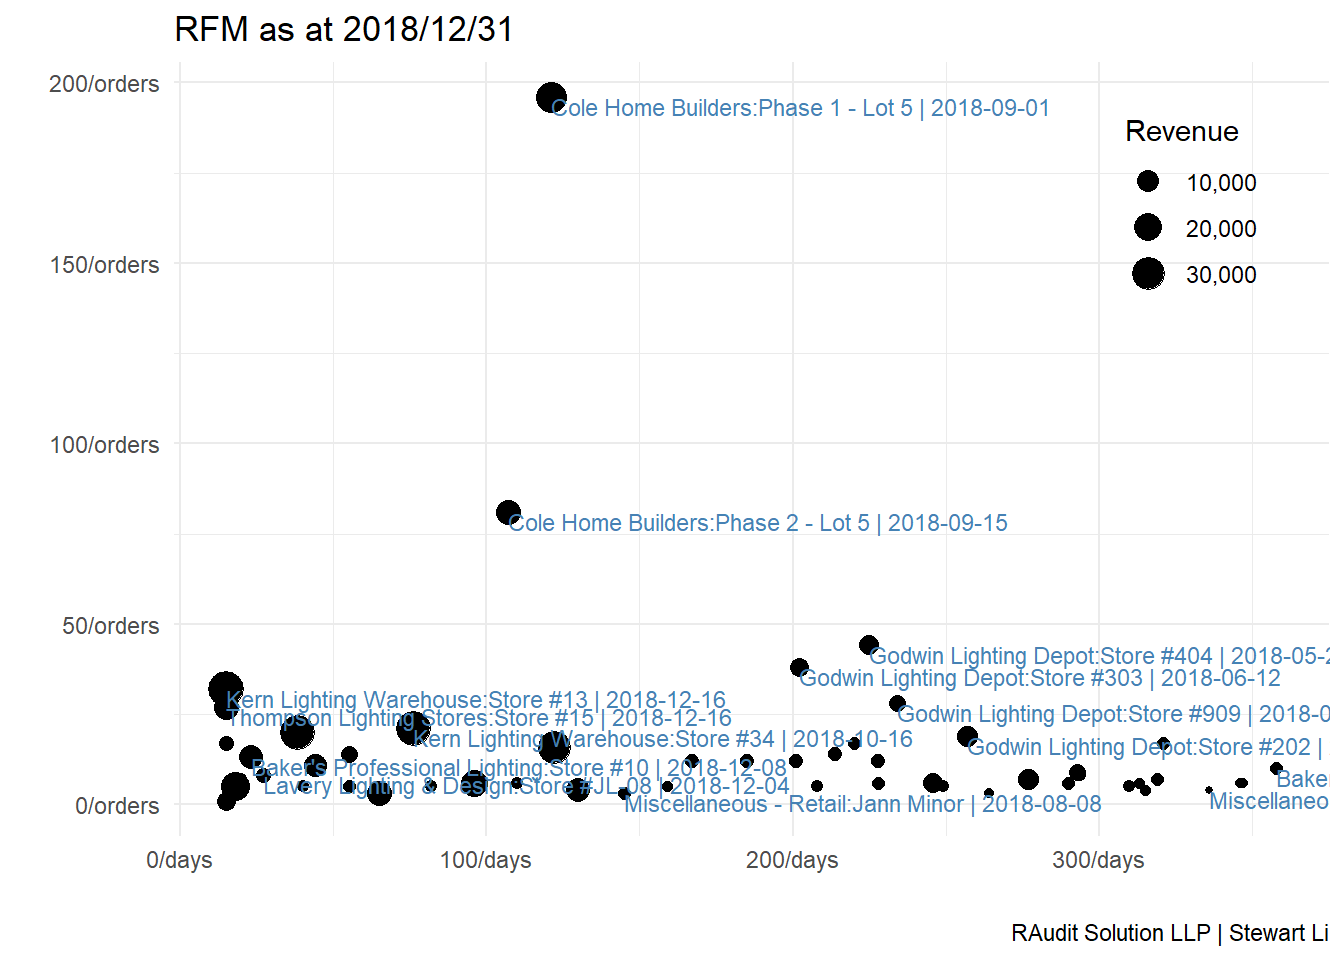
Customer churn analysis (RFM)
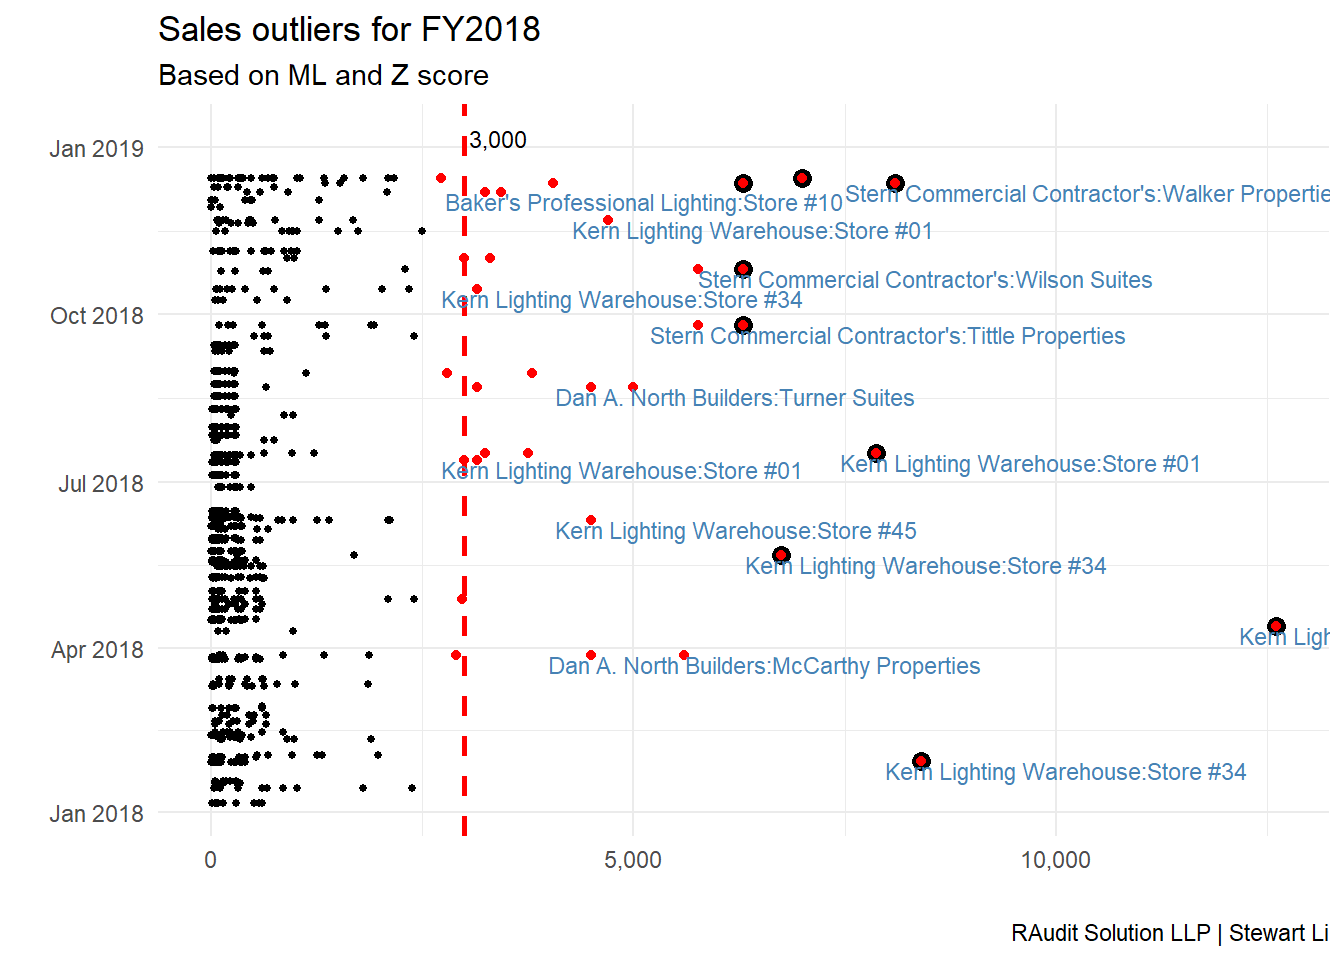
Sales outliers