This part covers EDA. Target variable is revenue.
Numeric descriptive statistics
  # A tibble: 41 x 13
     type  variable missing complete n     mean  sd    p0    p25   p50
     <chr> <chr>    <chr>   <chr>    <chr> <chr> <chr> <chr> <chr> <chr>
   1 nume~ account~ 0       184      184   "  1~ " 11~ 0     0     0
   2 nume~ adverti~ 0       184      184   "  1~ "  7~ 0     0     0
   3 nume~ busines~ 0       184      184   "   ~ "  5~ 0     0     0
   4 nume~ car_lea~ 0       184      184   "  3~ " 13~ 0     0     0
   5 nume~ compute~ 0       184      184   "   ~ "  2~ 0     0     0
   6 nume~ confere~ 0       184      184   "  2~ " 23~ 0     0     0
   7 nume~ contrib~ 0       184      184   "  1~ " 18~ 0     0     0
   8 nume~ depreci~ 0       184      184   "   ~ "  1~ 0     0     0
   9 nume~ dues_an~ 0       184      184   "  1~ "  9~ 0     0     0
  10 nume~ employe~ 0       184      184   "  1~ "  4~ 0     0     0
  # ... with 31 more rows, and 3 more variables: p75 <chr>, p100 <chr>,
  #   hist <chr>
Target variables
Central tendency
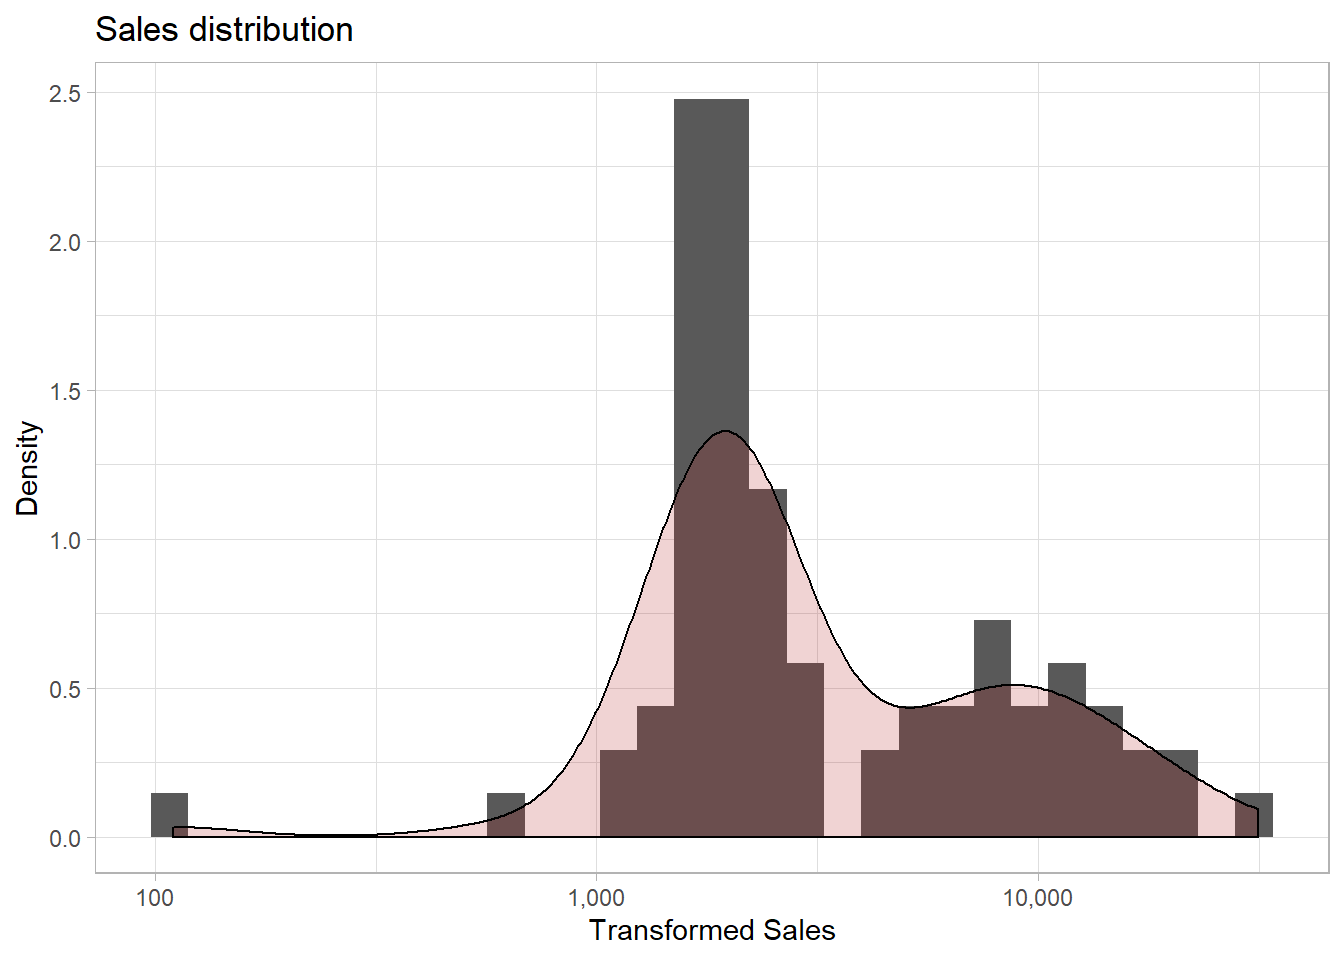
Normality
p < .05 then the distribution in question is significantly different from a normal distribution.
    Shapiro-Wilk normality test

  data:  df_pl$revenue
  W = 0.55243, p-value < 2.2e-16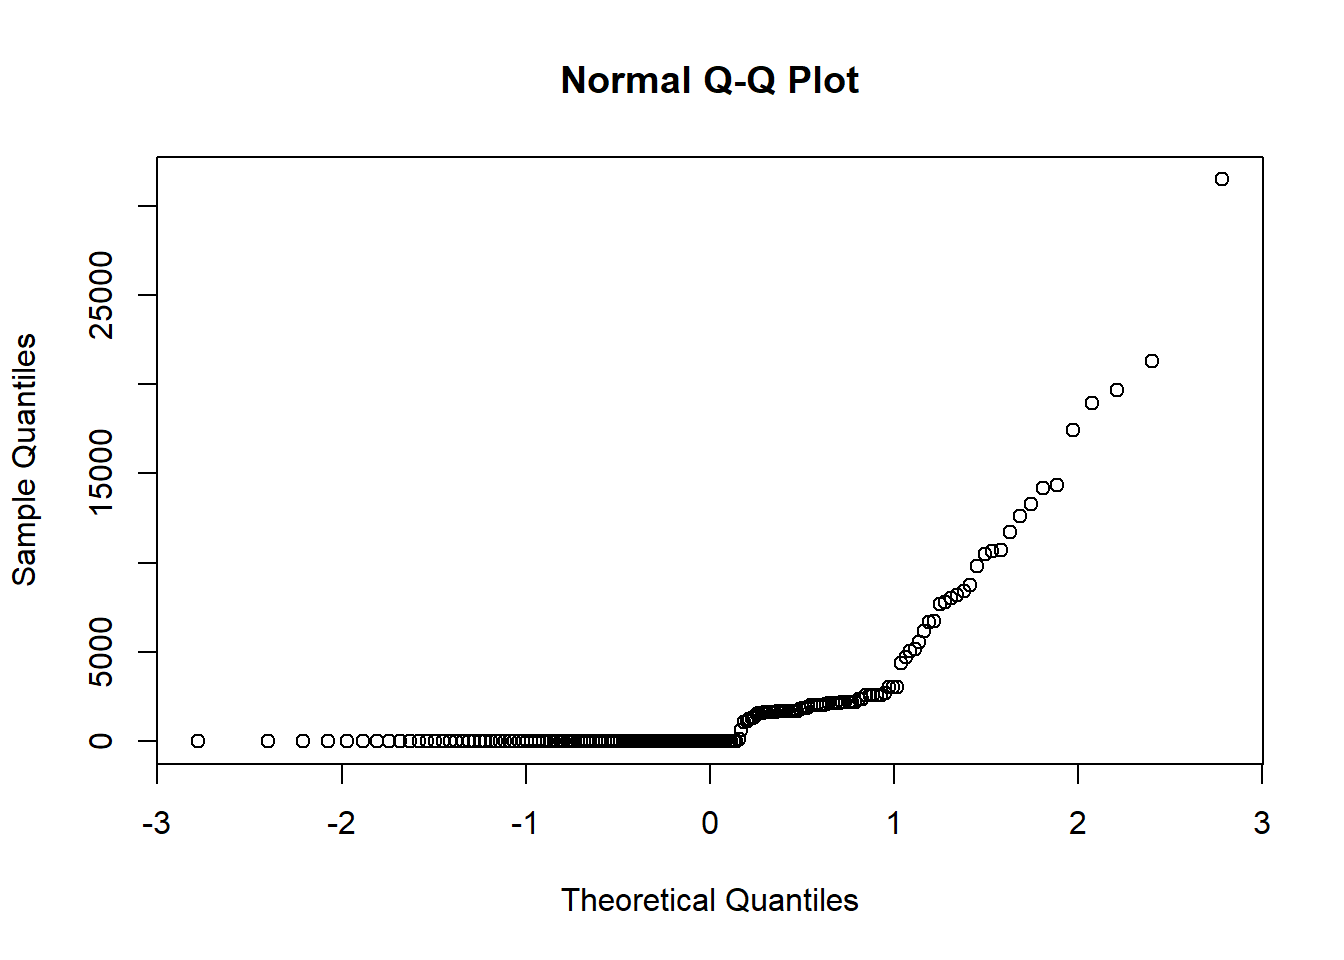
Correlation
Correlation matrix
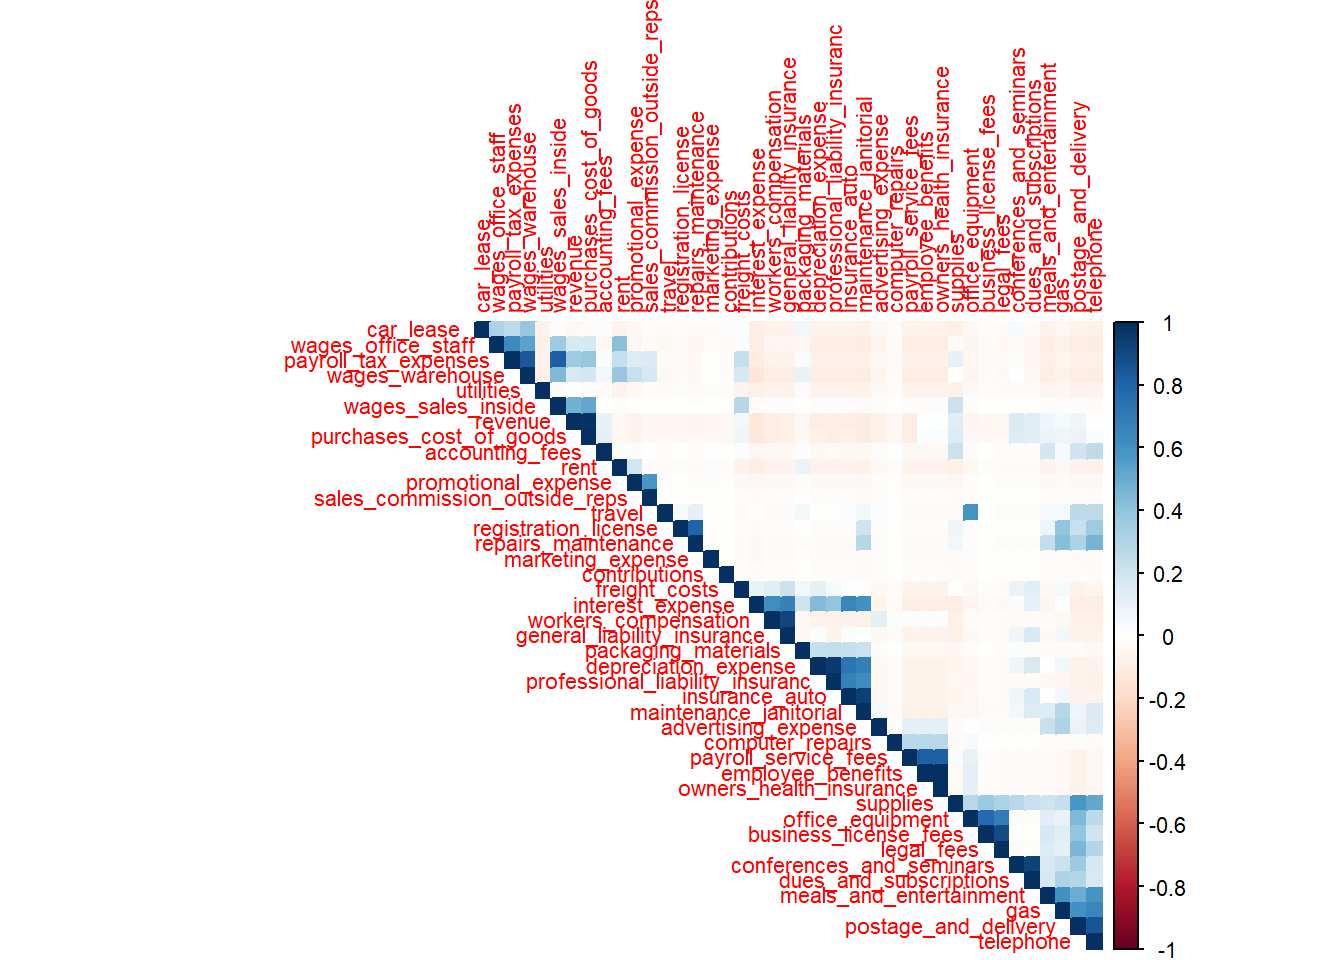
Selected variables
Select those variables having at least 0.10 of correlation with the target variable.
  # A tibble: 12 x 3
     rowname                  revenue purchases_cost_of_goods
     <chr>                      <dbl>                   <dbl>
   1 revenue                    1                       0.988
   2 purchases_cost_of_goods    0.988                   1
   3 wages_sales_inside         0.479                   0.511
   4 payroll_tax_expenses       0.357                   0.389
   5 wages_office_staff         0.165                   0.177
   6 wages_warehouse            0.160                   0.186
   7 conferences_and_seminars   0.159                   0.146
   8 supplies                   0.138                   0.149
   9 dues_and_subscriptions     0.135                   0.125
  10 interest_expense          -0.126                  -0.122
  11 maintenance_janitorial    -0.109                  -0.107
  12 accounting_fees            0.107                   0.111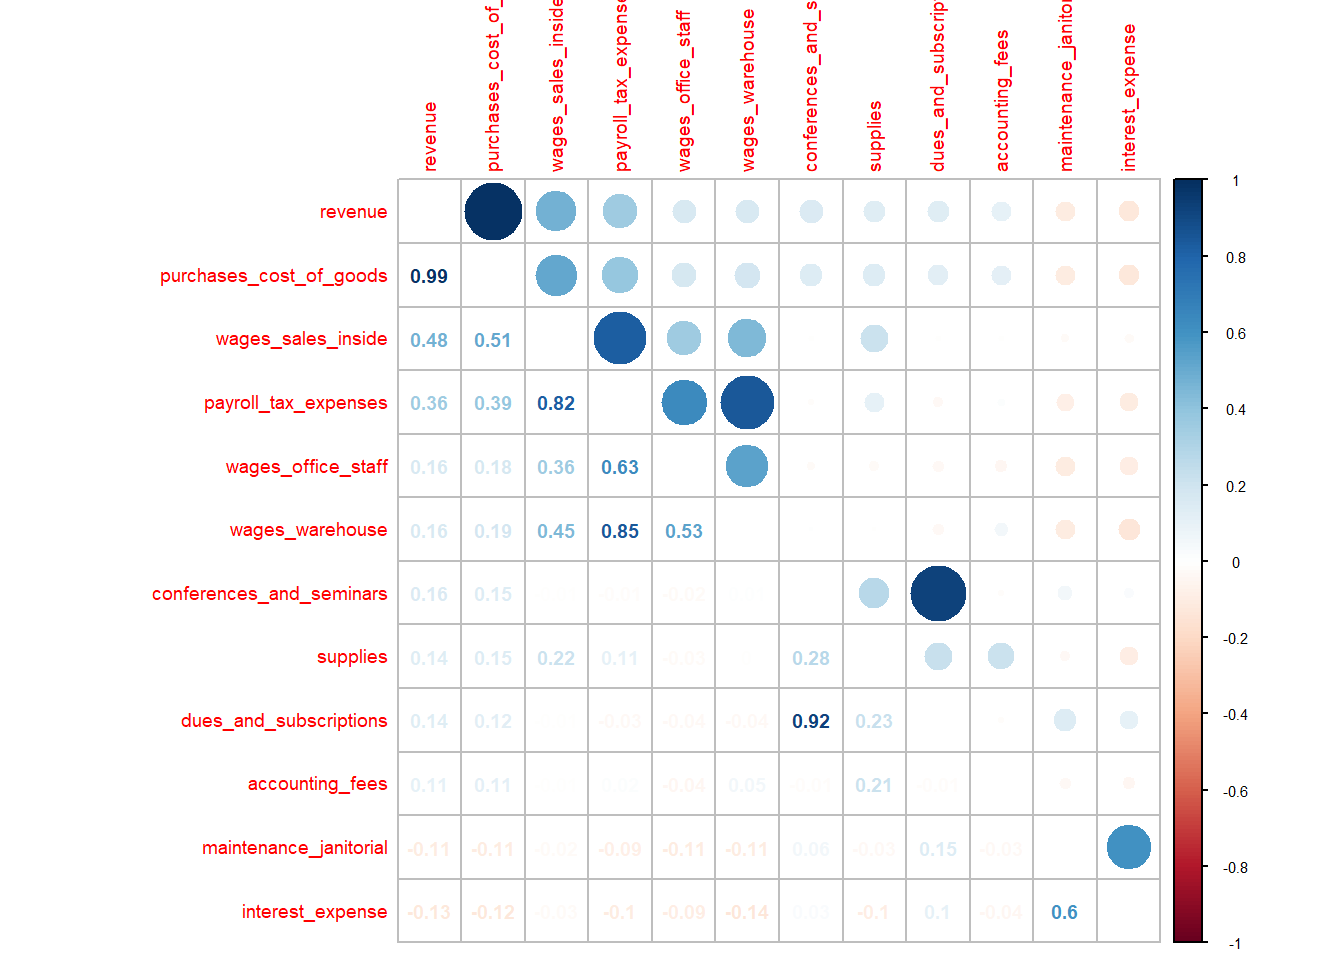
Partial correlation
Purchase has the strongest relationship with sales.
    Pearson's product-moment correlation

  data:  df_pl$revenue and df_pl$purchases_cost_of_goods
  t = 86.758, df = 182, p-value < 2.2e-16
  alternative hypothesis: true correlation is not equal to 0
  95 percent confidence interval:
   0.9841401 0.9911132
  sample estimates:
       cor
  0.988125
Holding other variables constant, purchase has the following relationship with sales.
     estimate       p.value statistic   n gp  Method
  1 0.9832985 1.442558e-119  68.12595 184 23 pearson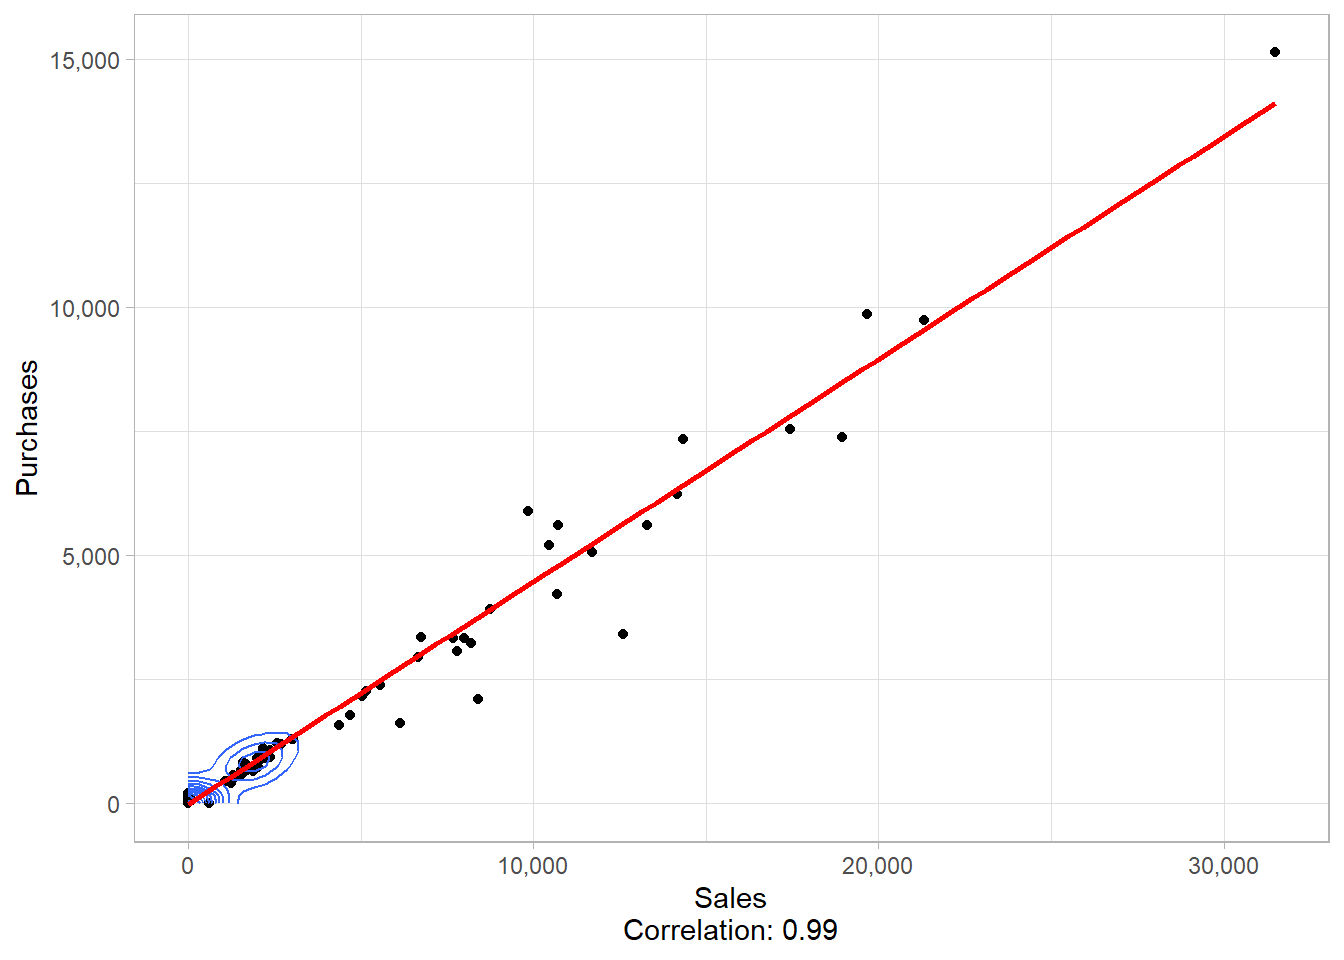
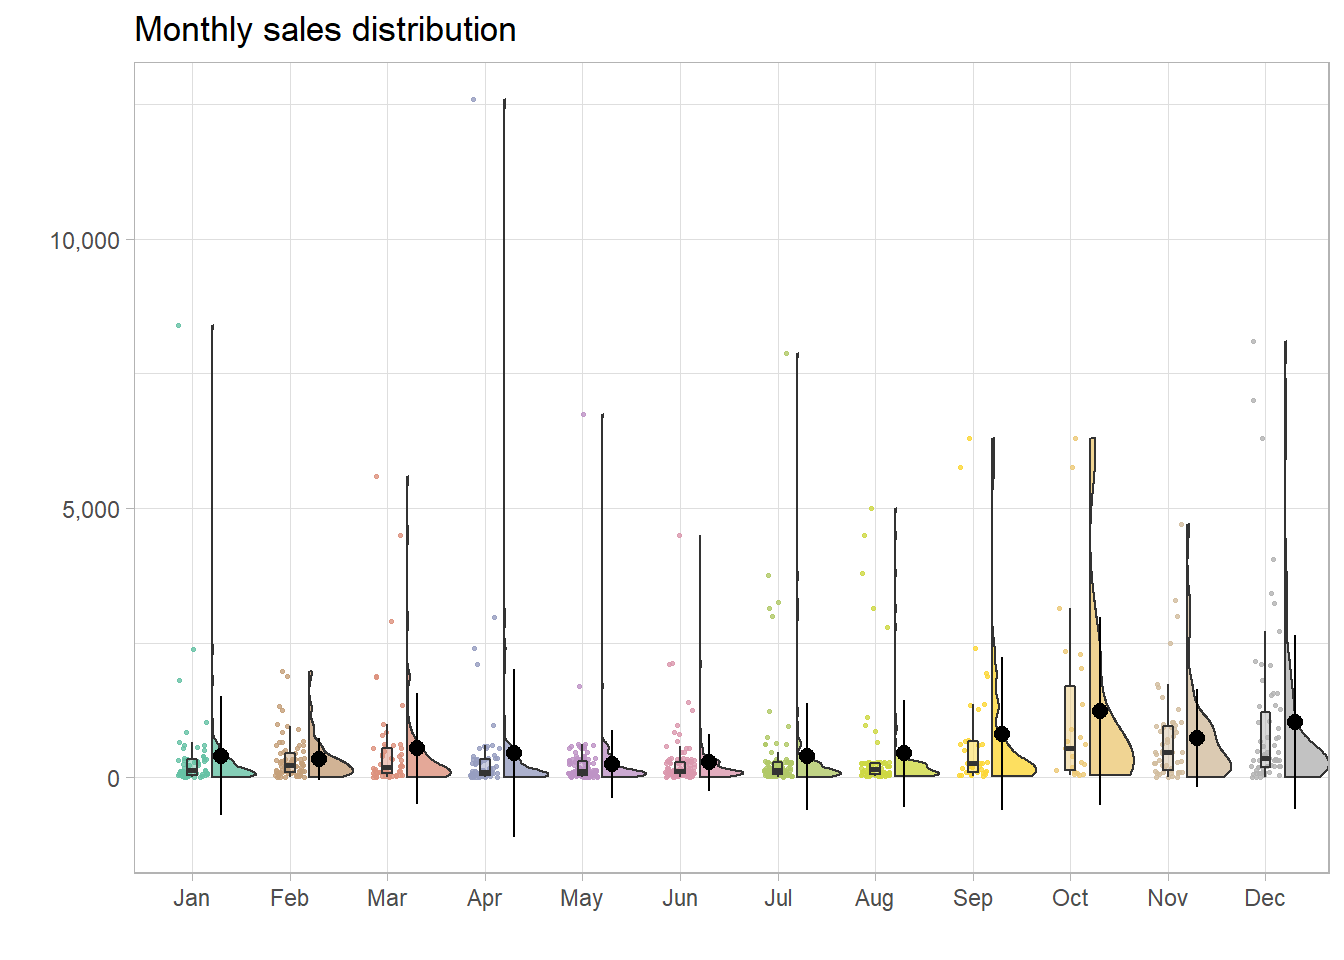
Categorical descriptive statistics
Monthly sales distribution
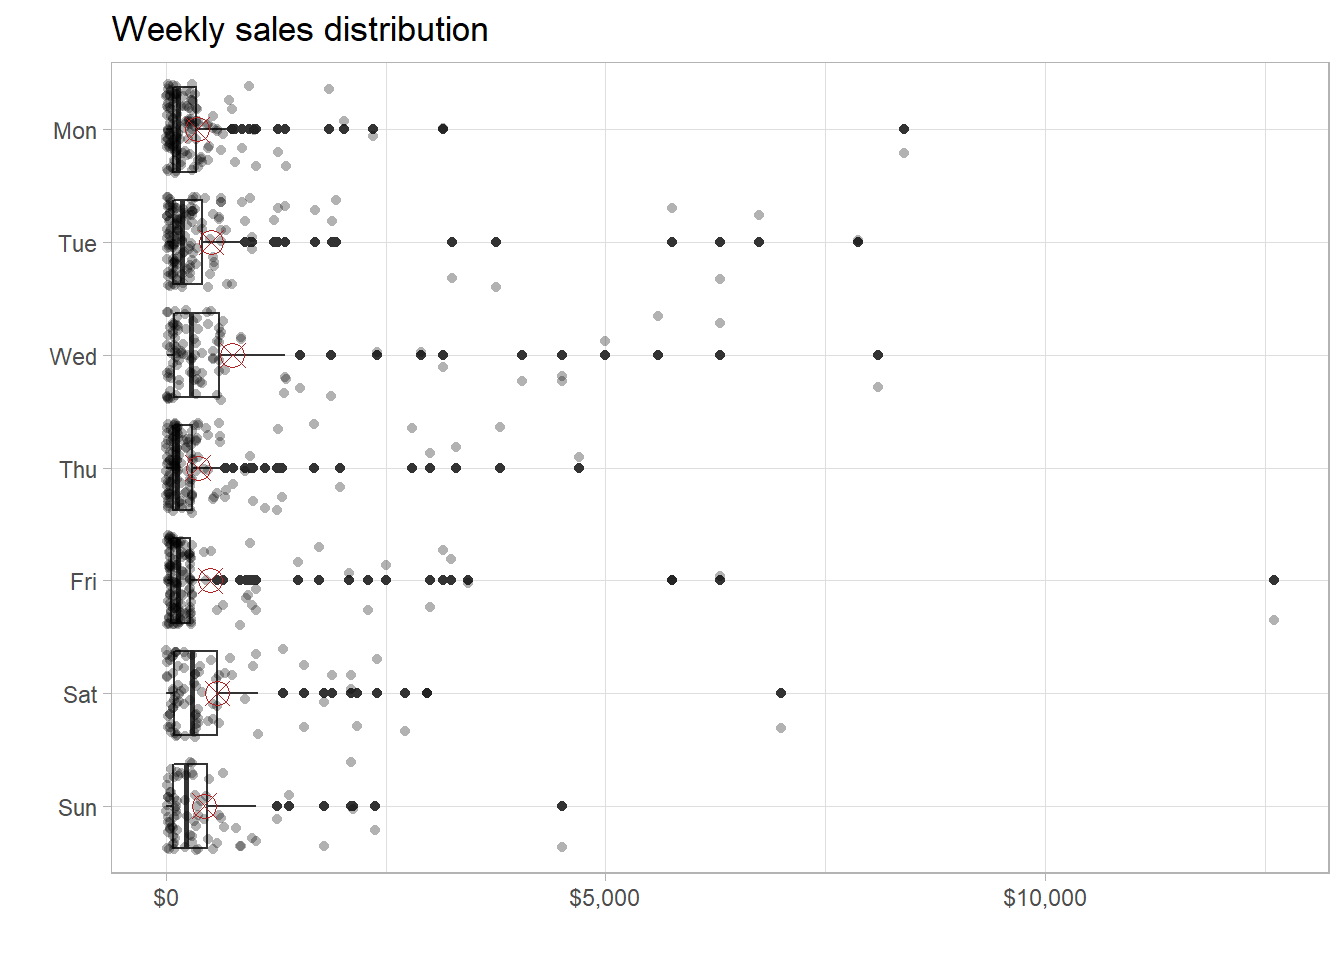
Weekly sales distribution