This part covers features selection. Target variable is revenue.
Principal Component Analysis (PCA)
Quickly running the statistical method suggests that four PCA should be selected as their variance is more than one.
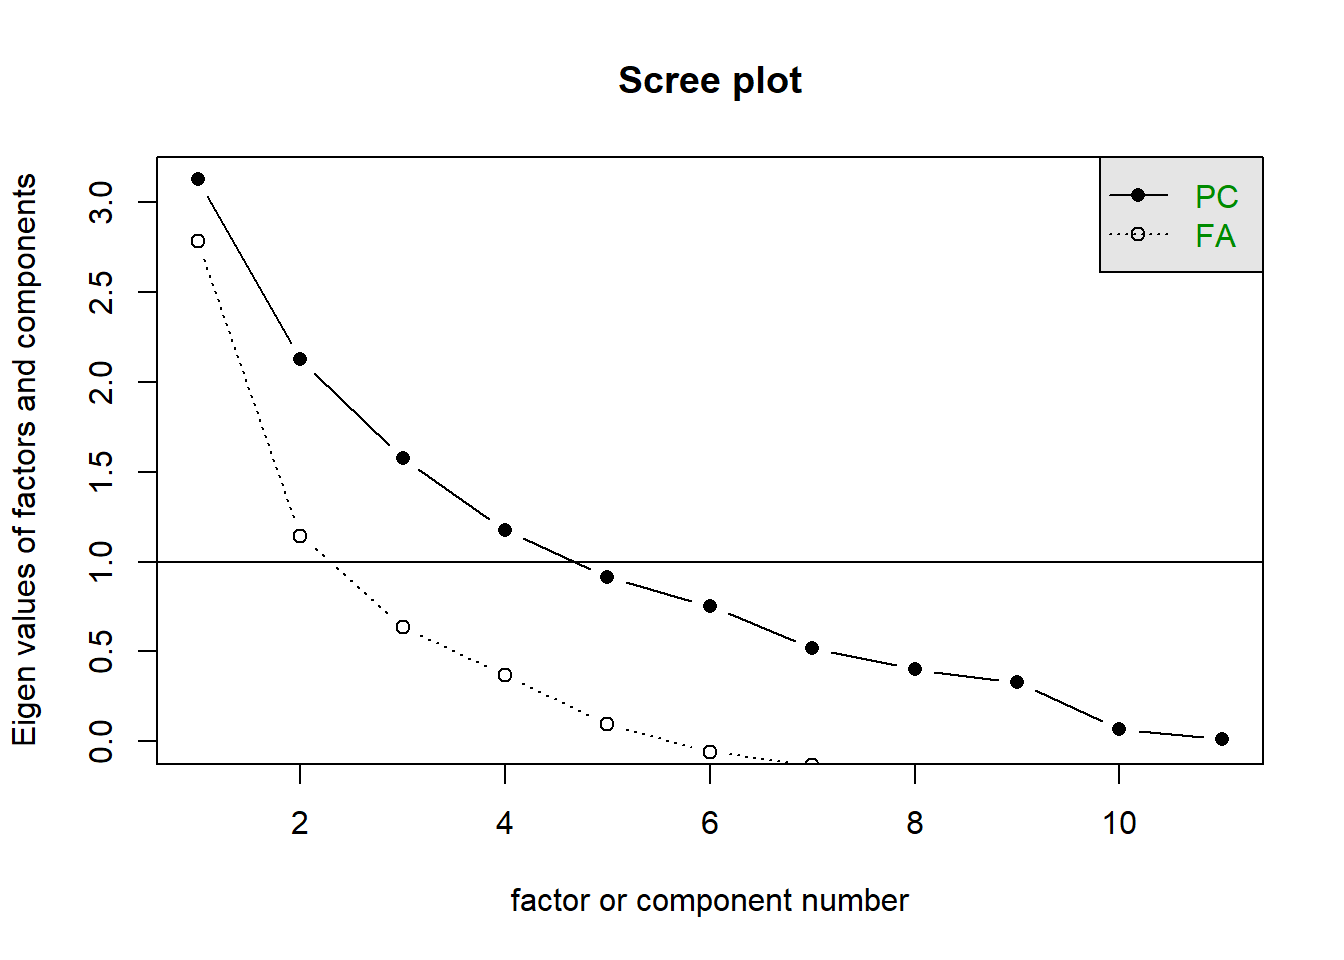
PCA model agrees to the above result. PCA1 and PCA2 totally explain 50% of the data.
  Importance of components:
                            PC1    PC2    PC3    PC4     PC5     PC6     PC7
  Standard deviation     1.7685 1.4583 1.2553 1.0853 0.95570 0.86823 0.71936
  Proportion of Variance 0.2843 0.1933 0.1432 0.1071 0.08303 0.06853 0.04704
  Cumulative Proportion  0.2843 0.4777 0.6209 0.7280 0.81103 0.87956 0.92661
                             PC8     PC9   PC10    PC11
  Standard deviation     0.63244 0.57264 0.2612 0.10591
  Proportion of Variance 0.03636 0.02981 0.0062 0.00102
  Cumulative Proportion  0.96297 0.99278 0.9990 1.00000
[1] 3.12764181 2.12662279 1.57575110 1.17797250 0.91335828 0.75382741
[7] 0.51748112 0.39997427 0.32791477 0.06823803 0.01121790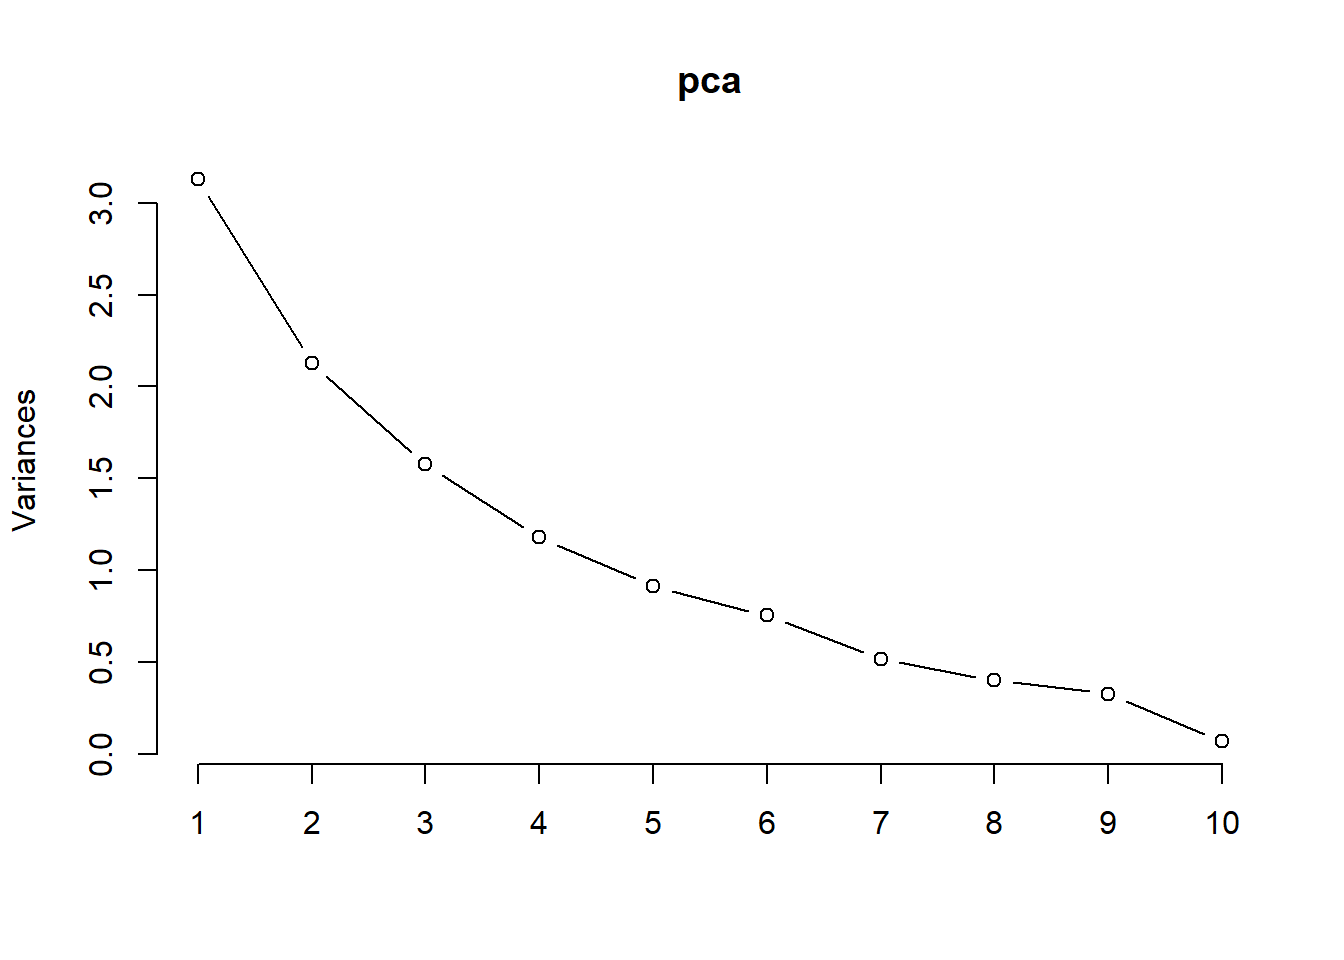
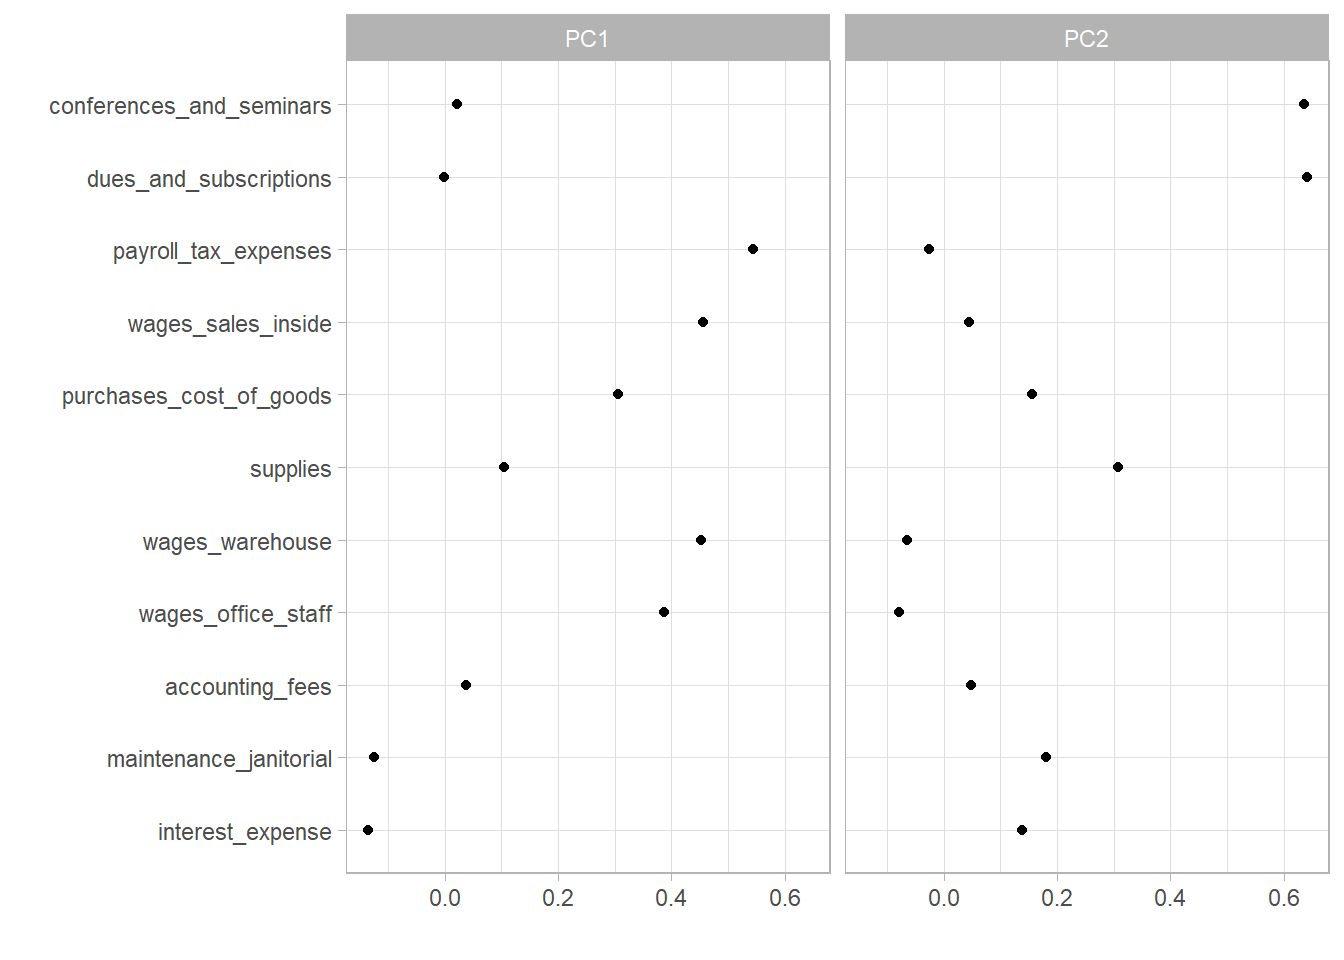
The following shows how predictors are attributable to PCA1 and PCA2. PCA1 is about the cost of goods sold. PCA2 is about training expenses.
PC1 PC2
purchases_cost_of_goods 0.540354592 0.22688394
wages_sales_inside 0.807509613 0.06553913
payroll_tax_expenses 0.962877059 -0.03686642
wages_office_staff 0.684733855 -0.11459216
wages_warehouse 0.800707693 -0.09377890
conferences_and_seminars 0.038125516 0.92636630
supplies 0.184608552 0.44801326
dues_and_subscriptions -0.002415228 0.93466058
interest_expense -0.240467576 0.20263019
maintenance_janitorial -0.220926086 0.26295870
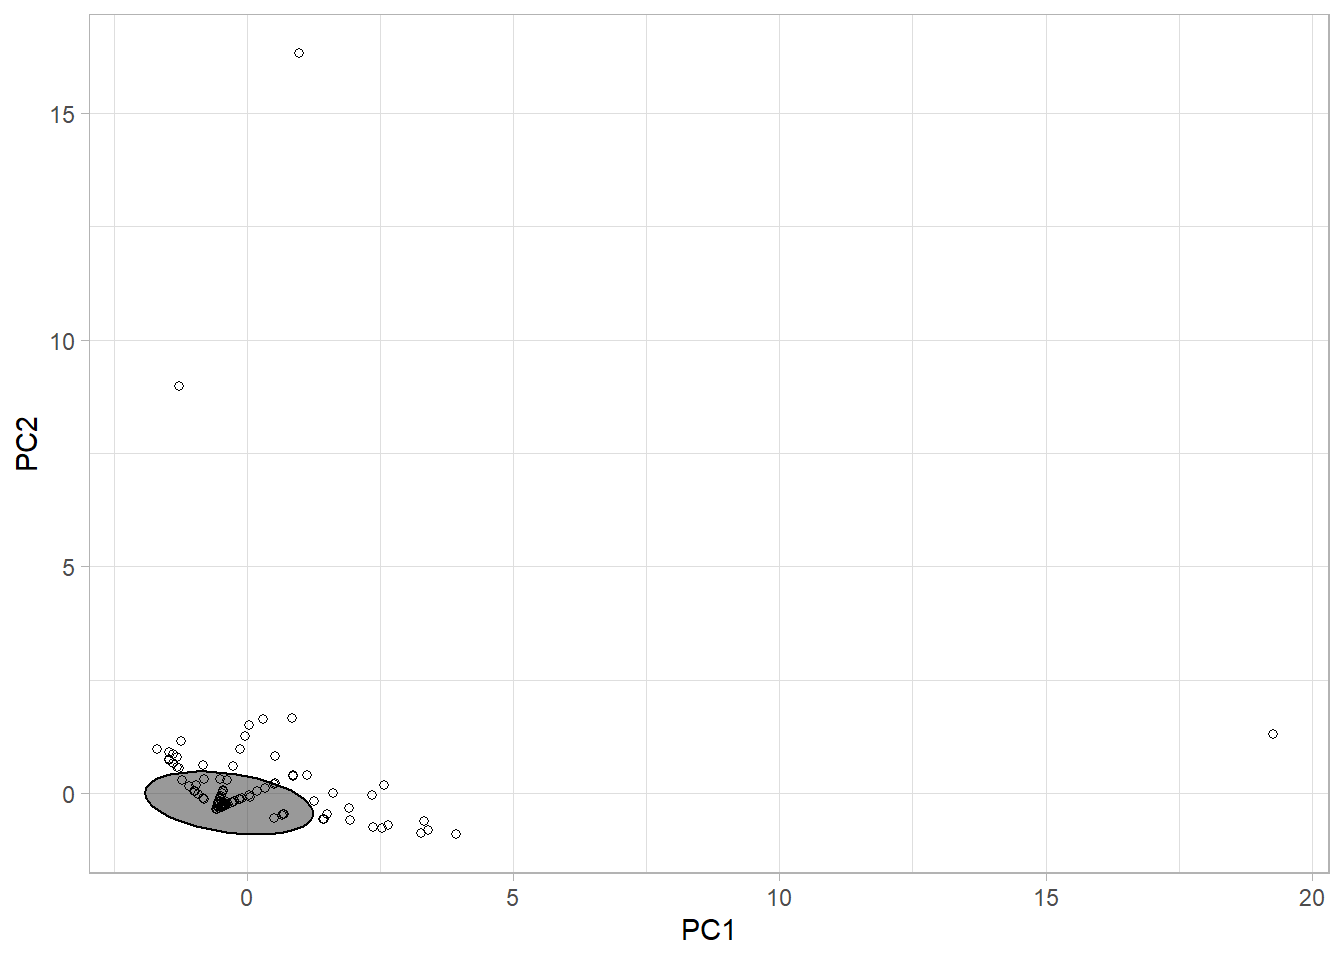
accounting_fees 0.065488670 0.06999316Scatterplot for all observations based on PCA1 and PCA2.
K-means clustering
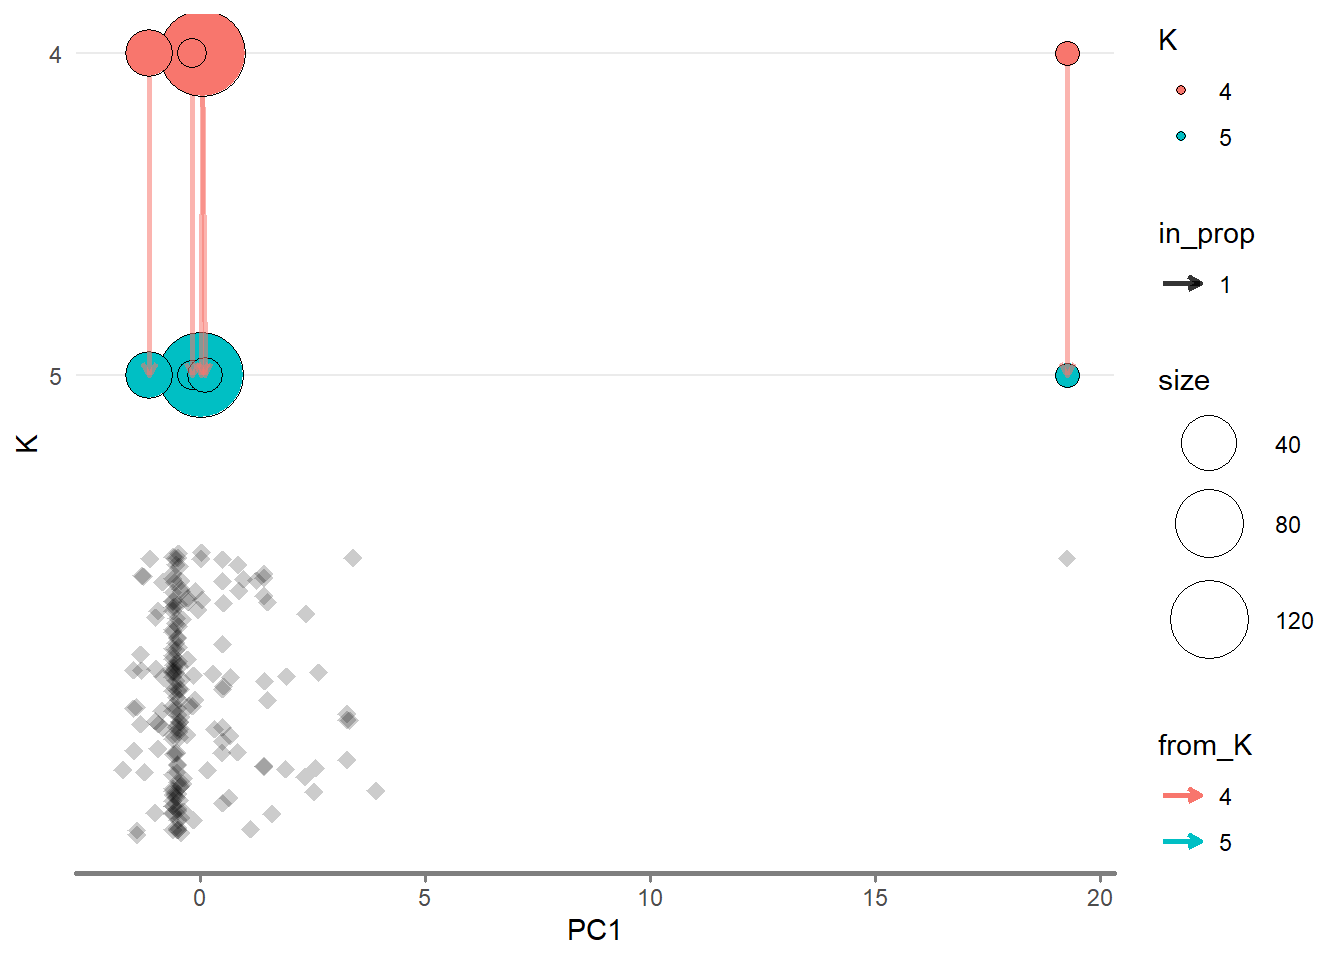
Try K to be 4 and 5. Compute the centroid of target variable based on four clusters. Three outliers identified by PCA appear again.
    cluster   revenue
  1       1 31478.000
  2       2  2223.322
  3       3  7493.975
  4       4   611.250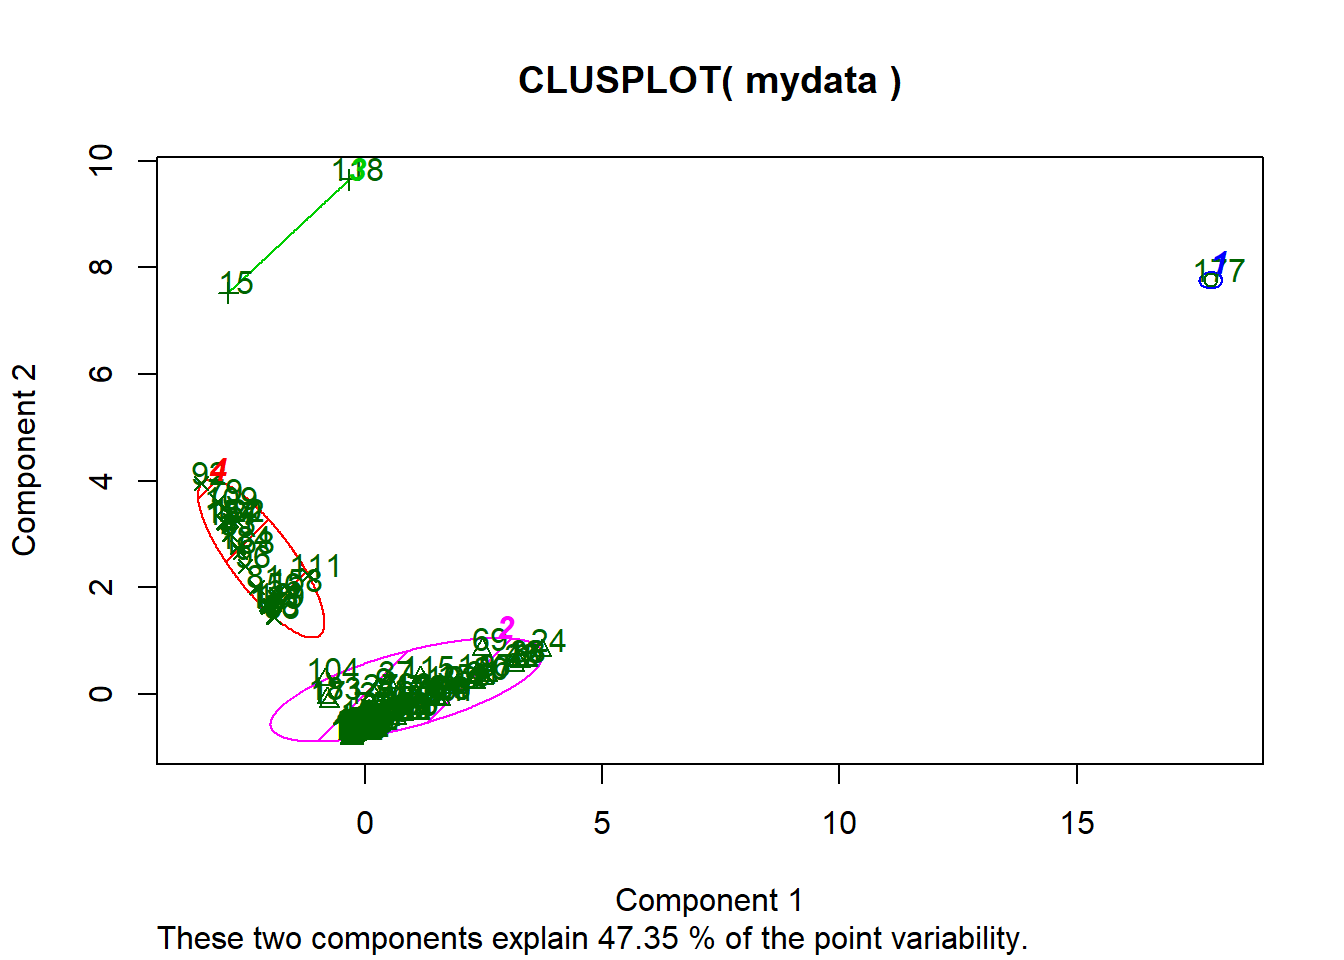
Plot K clusters along with PCA.
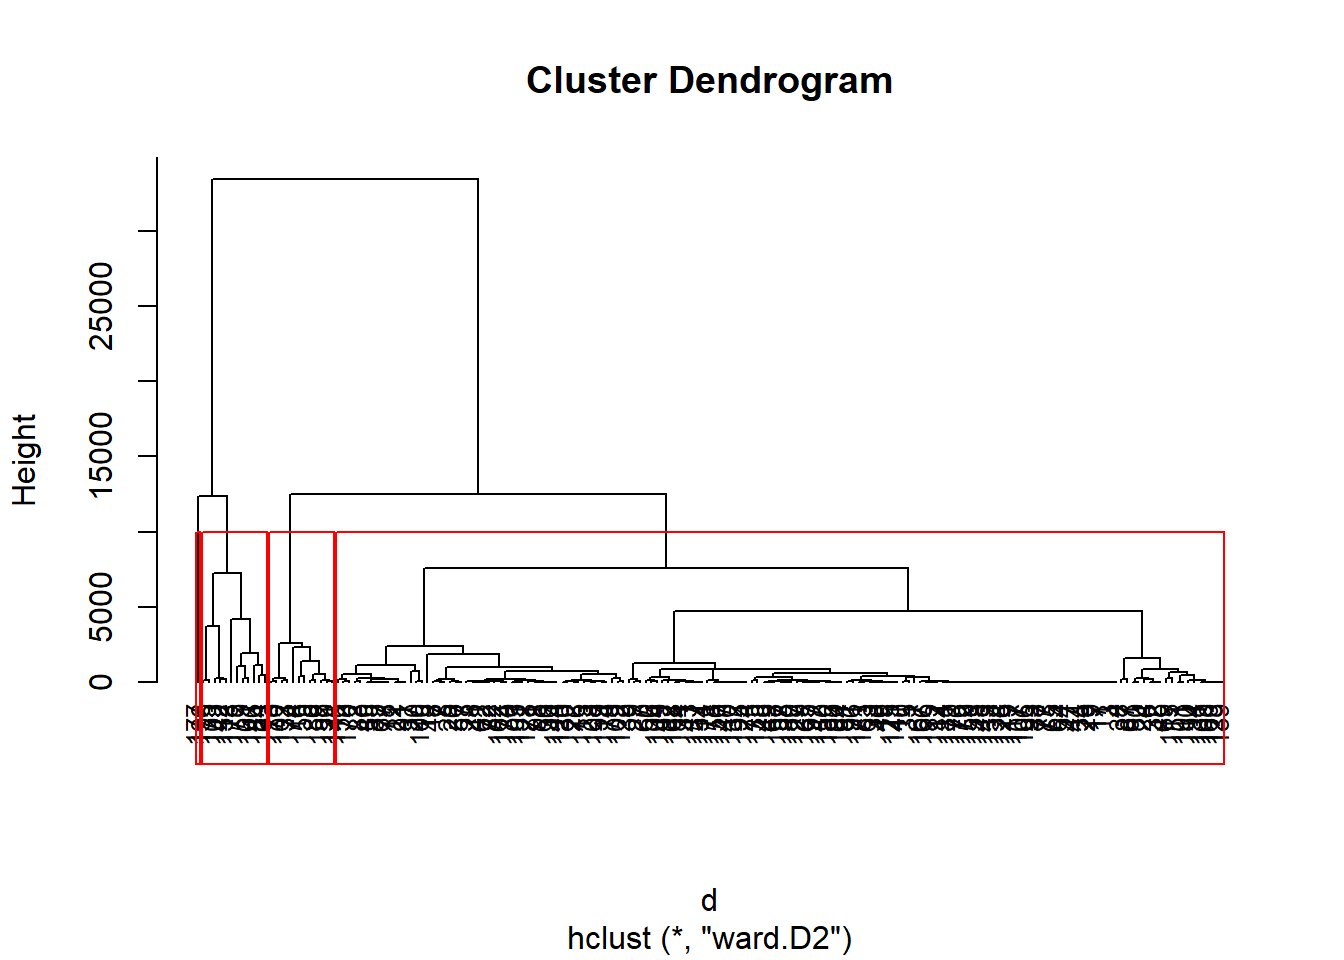
Hierarchical clustering
Random forest
Decision tree is not powerful enough to identify those important variables. Thus, random forest is used.
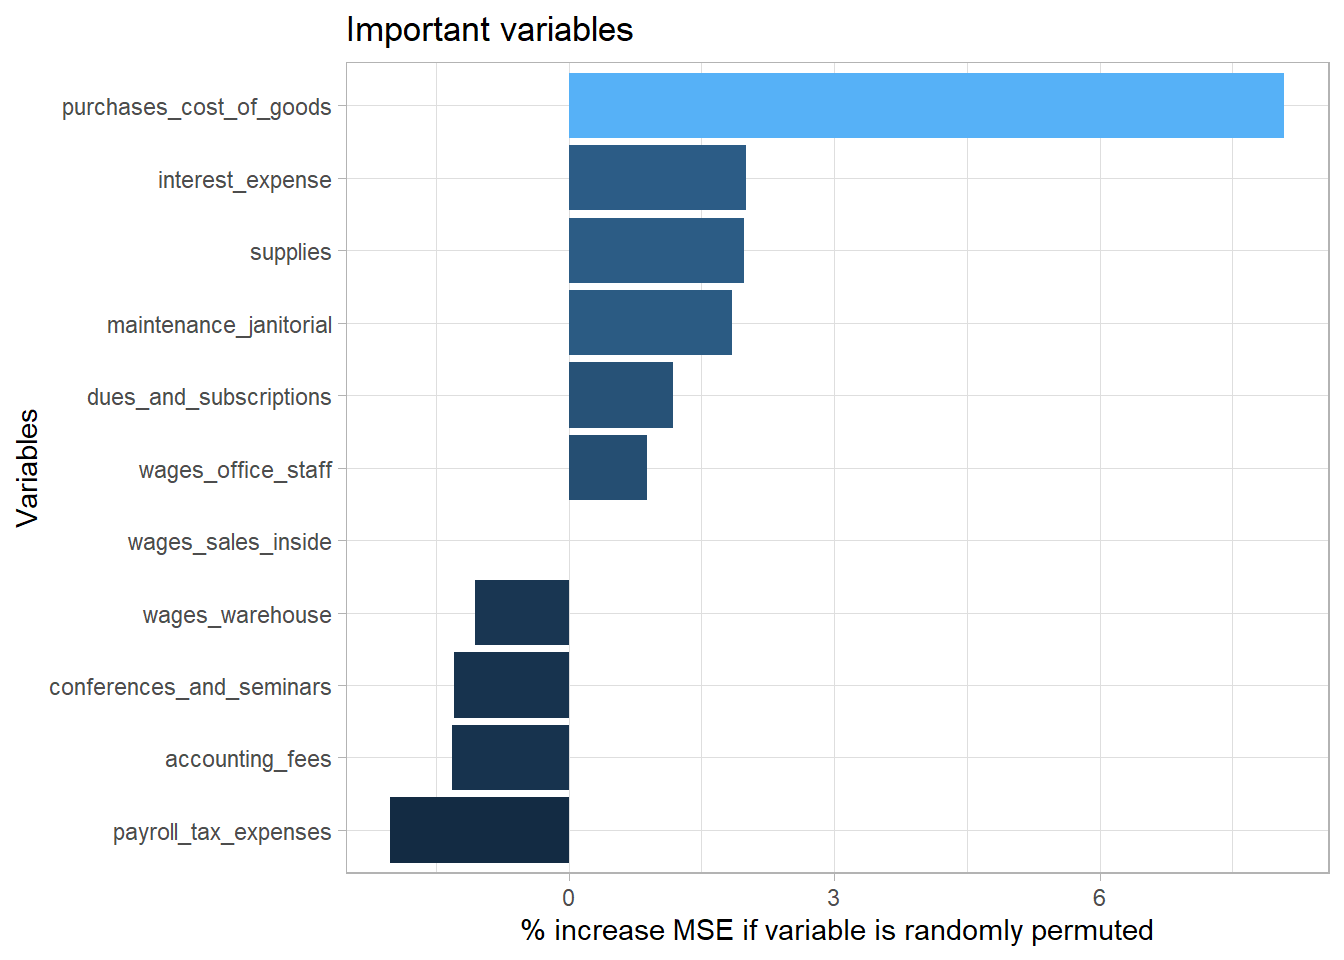
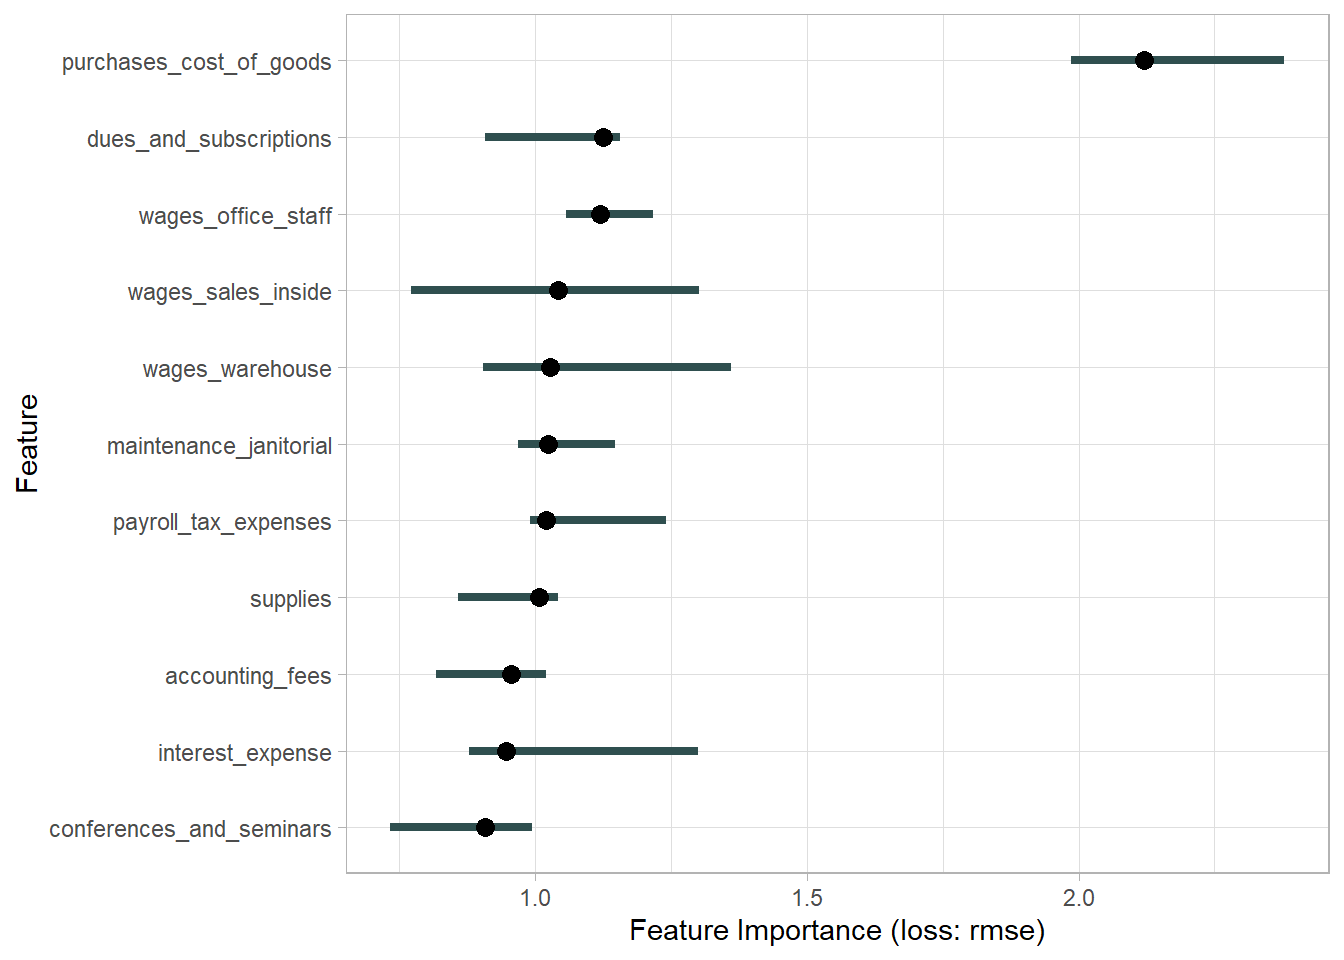
Feature importantance based on rmse.
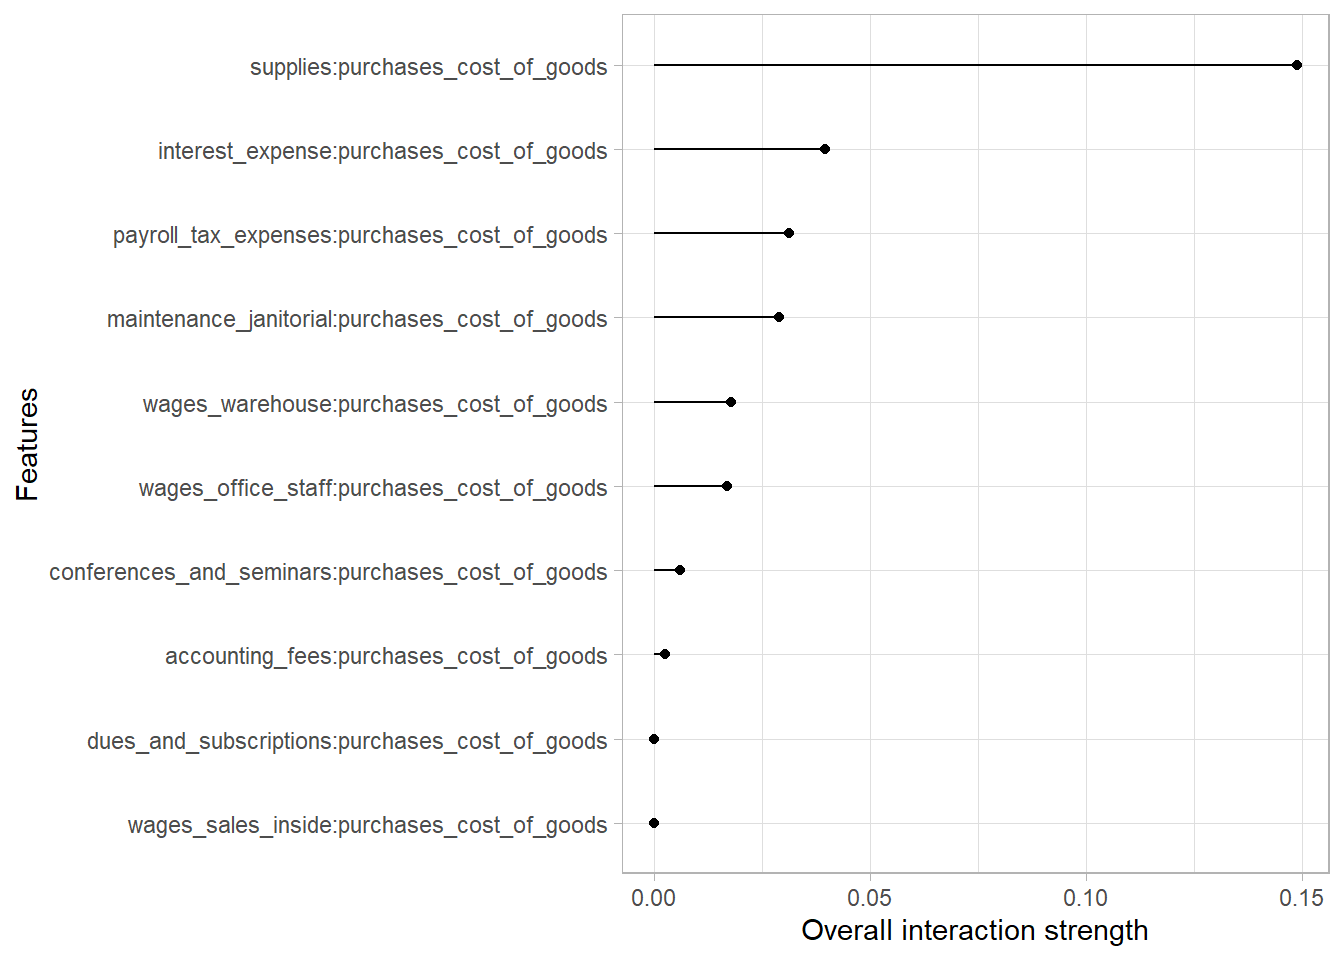
Interaction effect among predictors.